
Low-speed geared stepper efficiency tests are sensitive to torque ripple, sensor offsets, and fixture friction because useful mechanical power may be small.
Reliable results require a defined measurement boundary, synchronized signals, and stated operating conditions, while gearbox shaft efficiency remains distinct from DC-bus-to-output system efficiency for meaningful comparison between tests.
Which Efficiency Should You Measure?
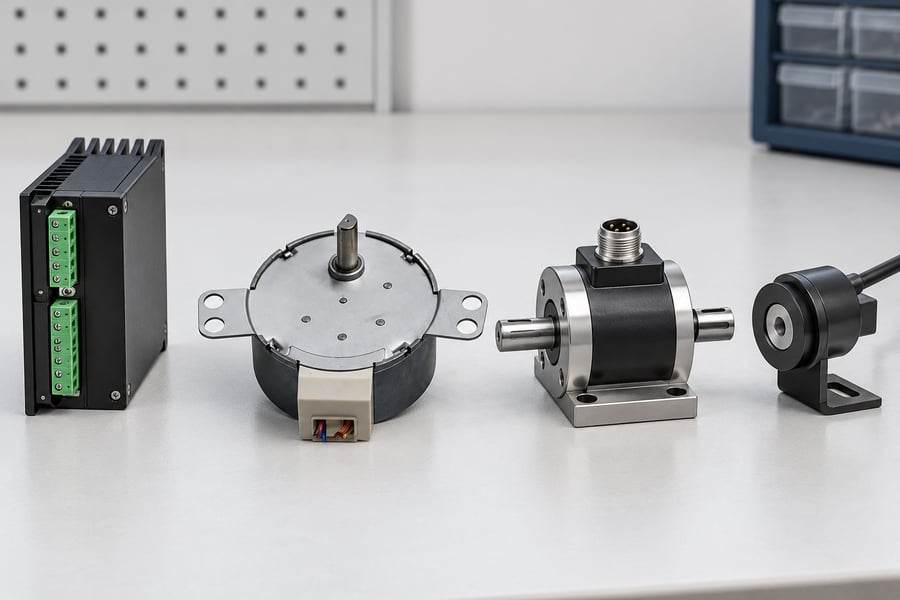
Gearbox mechanical shaft efficiency compares mechanical power entering the gearbox with mechanical power leaving it.
Its boundary begins at the gearbox input shaft and ends at the gearbox output shaft, excluding losses upstream in the motor and drive.
At a defined operating point, gearbox efficiency is output-shaft mechanical power divided by input-shaft mechanical power, expressed as a percentage.
Both powers must be measured or established with a defensible method at their respective shafts under the same load, speed, temperature, and time interval.
An integrated geared stepper motor may have a sealed gearbox or no accessible input shaft.
If torque and speed cannot be measured at that shaft, the test cannot directly establish gearbox-only efficiency.
A motor’s electrical input is not a substitute for gearbox input-shaft mechanical power.
For an assembly supplied through a DC bus, system efficiency is output-shaft mechanical power divided by electrical power entering at the defined DC-bus boundary.
When that bus feeds the drive, the metric includes drive, motor, and gearbox losses downstream of the measurement point.
The measurement location matters.
Measuring electrical power at the drive input includes drive losses, whereas measuring at a different electrical node establishes a different boundary.
Identify the actual voltage and current measurement points before calculating or comparing results.
The geared stepper motor configuration may be evaluated using different efficiency metrics depending on accessible shafts and the engineering question.
Report the metric by its full name, identify each measurement point, and never compare results from different boundaries as equivalent.
These distinctions also affect product selection.
Gearbox efficiency describes mechanical transmission performance, while DC-bus-to-output efficiency describes overall energy conversion under specified conditions.
Neither metric alone establishes holding capability, positioning accuracy, or performance across every operating speed.
How Do You Calculate Shaft Power at Low Speed?
Mechanical shaft power depends on torque and angular velocity.
Use the plain-text relationships P = T × omega and omega = 2 × pi × n / 60, where P is power in watts, T is torque in newton-metres, omega is angular velocity in radians per second, and n is rotational speed in revolutions per minute.
Calculate input-shaft power and output-shaft power separately using torque and speed measured at each shaft.
Under consistent motoring sign conventions, gearbox mechanical efficiency is eta = P_out / P_in × 100%.
Confirm the sign convention before applying this ratio, especially when operation includes braking or reversals.
At low speed, small errors in torque or speed can create large relative errors in calculated power.
A stable speed reading alone is insufficient if torque fluctuates substantially, and a nominal torque setting is not equivalent to measured shaft torque.
When torque varies over a sampling interval, calculate instantaneous mechanical power for each synchronized sample: p_i = T_i × omega_i.
Then calculate mean power as the arithmetic mean of those instantaneous products over the same valid time window.
The torque and speed samples must share a time base and represent the same operating interval.
Do not generally calculate mean power as mean torque multiplied by mean speed.
That shortcut omits the relationship between torque and speed fluctuations; it is valid only when the variation makes the difference negligible or the assumptions have been demonstrated for that test.
For example, if torque rises during slower parts of a cycle and falls during faster parts, multiplying the two separate averages can misstate the actual energy transferred.
Averaging synchronized instantaneous products preserves those variations and provides a more defensible result for pulsating stepper-motor output.
Choose the averaging window to match the claim.
For steady-state efficiency, first allow the assembly to reach the defined operating condition, then average over enough complete motion cycles to represent its repeatable behavior.
For cyclic operation, calculate mean input and output power over the same complete cycle or report energy efficiency using integrated input and output energy over that cycle.
At zero output speed, output shaft power calculated from torque times angular velocity is zero, even if the motor produces holding torque.
At standstill, the gearbox shaft-power ratio is undefined because both shaft powers are zero.
Holding torque and electrical holding consumption should be reported separately.
Table 1. Efficiency metrics and required measurements
| Metric | Required input measurement | Required output measurement | What the result represents |
| Gearbox mechanical shaft efficiency | Torque and speed at gearbox input shaft | Torque and speed at gearbox output shaft | Mechanical power transfer across the gearbox only |
| DC-bus-to-output system efficiency | Synchronized DC-bus voltage and current | Torque and speed at output shaft | Electrical input-to-mechanical output efficiency across the stated system boundary |
| Cycle-based system efficiency | DC-bus energy over a defined cycle | Output shaft energy over the same cycle | Energy conversion across that cycle, including its specified motion phases |
For cycle-based measurements, integrate input and output power over the same interval before calculating the energy ratio.
This approach accounts for changing speed, acceleration, deceleration, and other operating phases that a single steady-state measurement cannot represent.
Finally, do not infer gearbox mechanical efficiency from DC current alone.
Current does not independently establish shaft torque, rotational speed, or total electrical input power.
A defensible efficiency result requires measurements appropriate to the chosen boundary and operating condition.
Which Instruments and Calibration Methods Are Suitable?
Select a Torque Sensor for the Actual Operating Range
At low output speed, torque measurement can dominate the uncertainty in calculated mechanical power. Choose a sensor whose usable measurement range covers the expected torque without sacrificing resolution through unnecessary oversizing.
Check accuracy and repeatability across the actual working range, not merely the sensor’s headline full-scale specification. A sensor that performs well near full scale may provide insufficient confidence when measuring much smaller torques.
Consider sensor resolution, nonlinearity, hysteresis, temperature sensitivity, and rated overload capacity. These characteristics affect whether small torque changes represent genuine mechanical behavior or limitations in the measurement chain.
Check Zero Offset, Drift, and Calibration
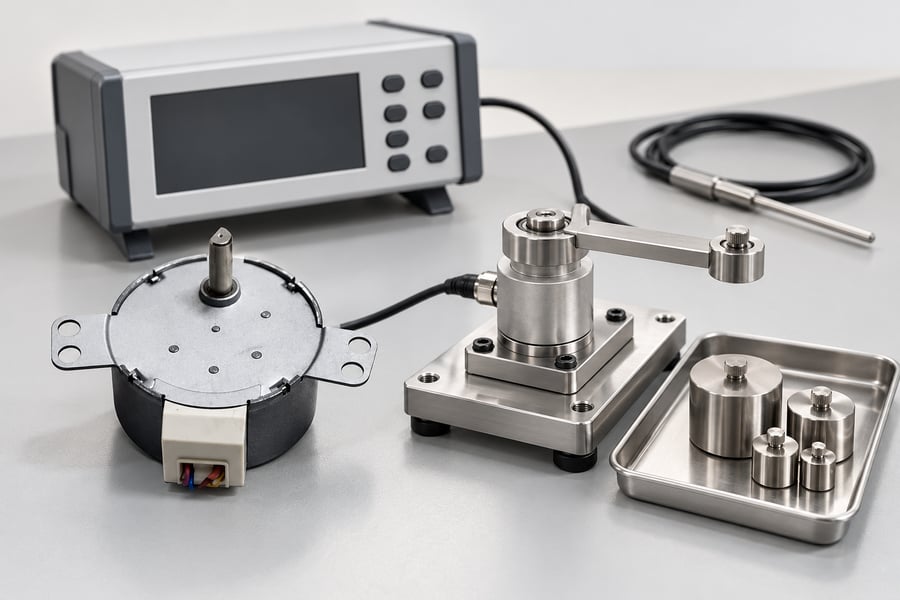
Record the torque sensor’s zero reading before each test series under the specified mounting and thermal conditions. A small offset can become a substantial fraction of the measured torque when output power is low.
Check zero again after testing to identify drift. If the reading changes, investigate temperature variation, mounting stress, electrical interference, or mechanical preload before accepting the measurements.
Verify the torque sensor’s calibration by applying traceable torque values spanning the complete measurement range expected during the low-speed efficiency test.
Confirm calibration status, applicable uncertainty, and the measurement direction; reversal testing may require checking both positive and negative torque.
Do not treat zeroing as a replacement for calibration. Zeroing establishes the measurement baseline, whereas calibration evaluates the relationship between applied torque and indicated output across the relevant range.
Measure Actual Low Speed and Synchronize Samples
Use a suitable encoder, tachometer, or other speed measurement device to determine actual shaft rotation. Commanded step frequency alone does not prove that the rotor or output shaft follows the intended motion.
At very low speed, limited encoder resolution and short observation windows can produce unstable speed estimates. Select an acquisition method that resolves the actual motion without smoothing away meaningful acceleration or speed variation.
Synchronize torque and speed samples using a common time base or verified acquisition alignment.
When torque pulsates, even a small timing mismatch can pair a torque peak with the wrong angular velocity and bias calculated mean power.
Apply filtering only when its effects are understood and documented. Excessive smoothing can conceal step-related torque fluctuations, while inadequate filtering may allow noise to distort instantaneous power calculations.
Measure Electrical Input Power at the Defined DC-Bus Boundary
For DC-bus-to-output system efficiency, measure bus voltage and current at the same defined electrical boundary. Record synchronized voltage and current samples so their instantaneous products represent electrical input power accurately.
Calculate instantaneous electrical power by multiplying voltage and current at each synchronized sample, then average those products over the selected interval.
Multiplying average voltage by average current may produce a different result when the signals fluctuate together.
Choose measurement equipment with adequate bandwidth, resolution, and accuracy for the bus ripple and operating dynamics. Include relevant sensor calibration, offset, and acquisition uncertainties in the reported power uncertainty.
Account for Fixture Losses and the Measurement Boundary
Couplings, support bearings, torque transducers, and loading equipment can introduce friction or other parasitic losses. At low output power, these losses may be comparable to the mechanical power being measured.
Define whether the measured torque and power refer to the geared motor’s output shaft or another location in the test assembly.
Losses occurring between the actual output shaft and measurement point can otherwise be mistaken for losses inside the product.
Characterize fixture losses independently when a defensible method is available. Do not automatically subtract an unloaded fixture reading, because friction may change with speed, alignment, temperature, and applied load.
How Should You Control Operating Conditions?
Standardize the Mechanical and Electrical Setup
Keep mounting orientation, coupling alignment, fastening, and external loading consistent between tests. Misalignment or mounting distortion can introduce additional friction and bearing loads, changing measured output power independently of the intended operating point.
Record the lubrication condition, ambient temperature, supply voltage, and relevant drive settings. Changes in these variables can alter motor heating, gearbox friction, current demand, and measured efficiency.
The stepper motor characteristics and drive configuration also influence the behavior of an integrated assembly. Record the actual configuration used rather than assuming different current settings or control modes produce equivalent operating conditions.
Separate Steady-State and Cyclic Measurements
For steady-state testing, allow speed, load, and temperature to stabilize according to predefined criteria. Then acquire torque, speed, and any required electrical signals over a representative, consistent measurement interval.
For cyclic operation, include complete representative cycles and synchronize the input and output measurements across the same interval. Acceleration, deceleration, dwell periods, and reversals can materially change average power and energy consumption.
Startup measurements should remain separate from steady-state results unless startup is explicitly part of the reported duty cycle. Transient behavior can produce different torque, current, and power patterns that a stabilized measurement does not capture.
Evaluate Zero-Speed Holding Separately
At standstill, a stationary gearbox has zero input and output shaft mechanical power because angular velocity is zero. The gearbox shaft-efficiency ratio is therefore 0/0, which is undefined rather than a measurable rotating efficiency.
If the energized motor draws positive DC-bus power while holding a stationary load, output mechanical power remains zero.
Dividing that zero output power by positive electrical input gives a numerical system-efficiency ratio of zero, but this is not a useful rotating-efficiency rating.
Evaluate holding performance separately using specified holding torque, load conditions, energization state, duration, temperature, and any permitted shaft movement. Record electrical input and heating where relevant, without presenting holding torque as continuous mechanical output power.
Repeat Tests Under Comparable Conditions
Repeat measurements at the same operating point to distinguish genuine performance differences from instrument variation or setup changes. Record any deviations in load, temperature, speed, mounting, or measurement configuration.
If repeated results disagree, investigate sensor drift, insufficient speed resolution, fixture friction, thermal changes, and synchronization before averaging them. Preserve the individual results so repeatability and uncertainty remain visible during subsequent analysis.
What Is the Correct Low-Speed Efficiency Test Procedure?
Define the Test Before Applying Power
Document the efficiency metric, mechanical and electrical measurement boundaries, target operating point, load, and duty cycle before testing begins. Specify which signals will be measured and how efficiency will be calculated.
Inspect sensor calibration status, coupling alignment, mounting, and wiring before energizing the assembly. Confirm that the torque sensor, speed measurement system, and electrical instruments can resolve the expected operating conditions.
Define stabilization criteria before collecting steady-state data. These criteria should address speed, load, and temperature stability, preventing transient behavior from being inadvertently included in a nominal steady-state efficiency result.
Acquire Synchronized Measurements
Once the assembly stabilizes, acquire torque and angular velocity simultaneously using a shared time base or verified synchronization method. Calculate instantaneous mechanical power from corresponding samples, then average over the same valid measurement window.
For DC-bus-to-output efficiency, acquire voltage and current synchronously with sufficient temporal resolution to capture relevant fluctuations. Calculate instantaneous electrical power from each paired voltage-current sample and average those products over the identical interval.
Check that sampling frequency, sensor bandwidth, and filtering preserve the variations relevant to the calculation. Misaligned timestamps or excessive filtering can distort measured power even when individual sensor readings appear stable.
Repeat the measurement under the same conditions, allowing the assembly to stabilize again where necessary. Preserve each run separately to identify drift, inconsistent loading, or variation that might otherwise disappear within a combined average.
Match the Calculation to the Operating Cycle
For steady-state rotation, calculate mean input and output power across a representative interval. For cyclic operation, integrate instantaneous power over complete, consistently defined cycles rather than combining measurements from different operating phases.
Mechanical work over an interval is the time integral of shaft power. Use signed power consistently, distinguishing positive motoring work from negative mechanical energy returned through the shaft during braking or regeneration.
Electrical energy must follow an equally explicit sign convention. Define positive DC-bus power as energy entering the tested assembly and negative power as energy returned to the bus, if the measurement system supports bidirectional measurement.
For a regenerative cycle, report gross imported electrical energy and returned electrical energy separately when these quantities matter to the application.
A net-energy ratio may conceal substantial energy circulation or become unstable when net imported energy approaches zero.
Also consider changes in stored energy over the measurement interval. Rotor and load kinetic energy, bus capacitor energy, or other relevant storage can differ between cycle boundaries, affecting the interpretation of measured energy conversion.
For a repeatable cycle-efficiency result, use equivalent initial and final operating states wherever practical. If stored energy differs between boundaries, document the difference and avoid attributing the entire measured energy imbalance to conversion losses.
How Should You Evaluate Uncertainty and Report Results?
Identify the Dominant Measurement Errors
Evaluate uncertainty in torque, speed, voltage, current, timing alignment, and power calculation. Include relevant calibration uncertainty, sensor resolution, zero drift, fixture losses, and repeatability rather than reporting instrument accuracy alone.
At low output speed, small torque offsets may contribute substantially to calculated shaft power. Fixture friction and speed-resolution limitations can likewise become significant when useful output power approaches the measurement system’s practical resolution.
Efficiency uncertainty depends on uncertainty in both the numerator and denominator. When either measured power is very small, even modest absolute errors can produce large relative errors in the calculated ratio.
If output power is indistinguishable from zero within its measurement uncertainty, do not present the resulting efficiency percentage as reliable. Report the measured power, its uncertainty, and the limitation on calculating a meaningful ratio.
Distinguish Measurement Error from Product Performance
Investigate unexpected results before assigning them to gearbox losses. Check torque zero, speed measurement, sample alignment, fixture friction, temperature drift, and whether the selected averaging window captures the intended operating condition.
Avoid applying a generic fixture-loss correction without evidence that the correction represents the actual test condition.
If parasitic losses cannot be characterized reliably, report them as an uncertainty or limitation rather than implying they have been removed.
Table 2. Low-speed efficiency measurement errors and controls
| Error source | Potential effect | Practical control |
| Torque zero offset or drift | Biases calculated shaft power | Check zero before and after testing; verify calibration |
| Low speed resolution | Distorts angular velocity and power | Use suitable encoder resolution and longer representative windows |
| Unsynchronized samples | Miscalculates instantaneous power | Align torque, speed, voltage, and current timestamps |
| Fixture friction | Makes measured boundary losses appear larger | Define measurement locations and characterize parasitic losses |
| Thermal variation | Changes friction and sensor readings | Stabilize and record operating temperature |
| Very low measured power | Makes relative efficiency uncertainty large | Report absolute uncertainty and qualify or omit unreliable ratios |
Prepare a Reproducible Test Report
Identify the tested assembly, measurement boundary, operating mode, load, rotational speed, temperature, lubrication condition, mounting arrangement, and relevant drive settings. Record sensor models, calibration status, acquisition settings, and the calculation method.
Report measured input and output power alongside the calculated efficiency, units, averaging interval, and uncertainty. State whether results represent steady-state operation, a complete motion cycle, or another explicitly defined measurement window.
For cyclic tests, document the motoring and regenerative sign conventions, gross imported and returned energy where applicable, and any difference in stored energy between cycle boundaries. Explain how these factors affect the reported ratio.
Retain individual runs, calibration checks, raw synchronized data, processing settings, and any fixture-loss corrections. These records allow engineers to reproduce the calculation, compare equivalent operating conditions, and distinguish genuine performance changes from measurement limitations.